Page 1
Machine Learning Prediction of Concrete Compressive Strength Submitted by Deepak Yadav & Sabin Khatri Louisiana Tech University Instructor: Dr. Hadi Salehi Course: CVEN 5573 DATA ANALYTICS AND MACHINE LEARNING IN ENGINEERING Submission Date: May 18, 2026


Page 2
- Introduction and Project Objectives Concrete compressive strength is one of the most critical mechanical properties in civil and structural engineering. It directly determines the load-bearing capacity of structures such as buildings, bridges, and dams. Traditionally, compressive strength is determined through laboratory testing after 28 days of curing, which is time-consuming and costly. Machine learning offers a powerful alternative by predicting strength from mix proportions before physical testing begins. This project develops and evaluates machine learning models to predict concrete compressive strength using material composition and curing age data from the UCI Machine Learning Repository. Three regression models were implemented and compared: Random Forest Regressor, Support Vector Regression (SVR), and XGBoost Regressor. The project follows a complete machine learning pipeline including data exploration, preprocessing, model training, cross-validation, performance evaluation, and real-world validation against published experimental data. The primary objectives of this project are: • To develop regression-based machine learning models for predicting concrete compressive strength • To compare model performance using standard evaluation metrics (RMSE, MAE, R²) • To improve model accuracy through 5-fold cross-validation • To validate model predictions against real-world experimental data from published research
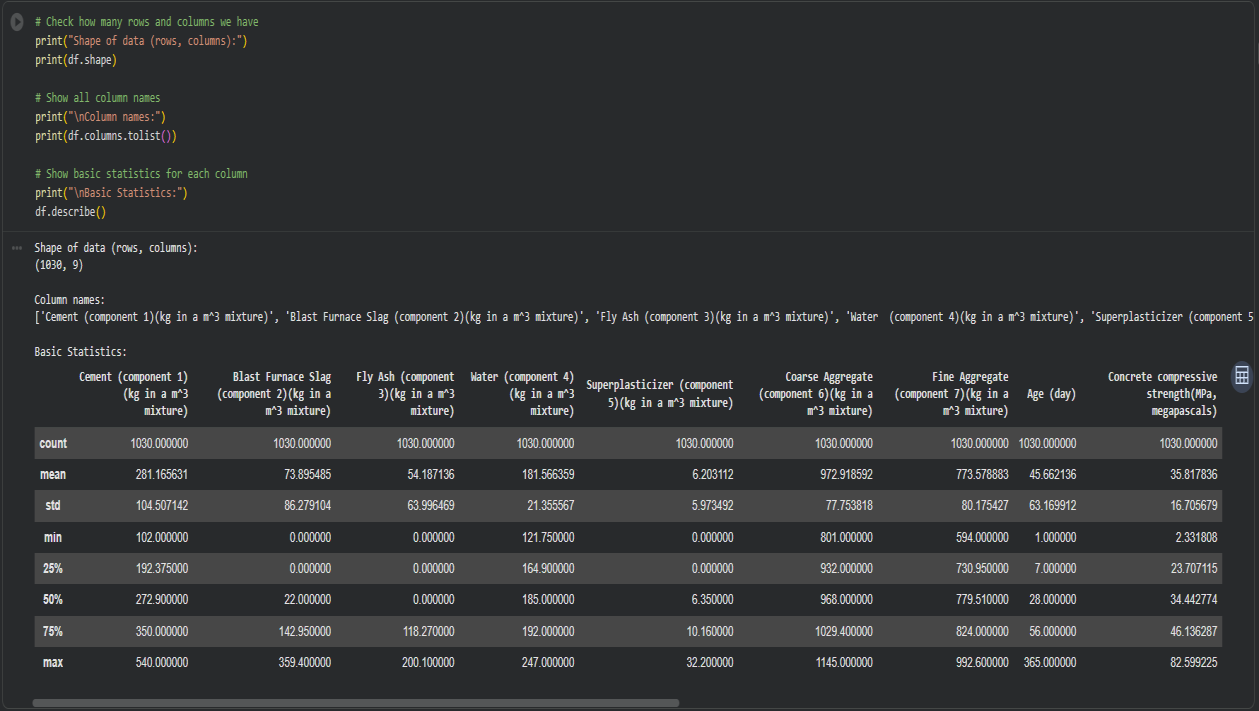
- Description of Dataset The UCI Concrete Compressive Strength Dataset was used for this project. The dataset was originally compiled by I-Cheng Yeh (1998) and is publicly available at the UCI Machine Learning Repository. The dataset contains 1,030 concrete mixture samples with 8 input features and 1 output variable as described below: Feature Unit Description Cement kg/m³ Primary binding material Blast Furnace Slag kg/m³ Industrial by-product additive Fly Ash kg/m³ Coal combustion by-product Water kg/m³ Water content of mix Superplasticizer kg/m³ Chemical workability enhancer Coarse Aggregate kg/m³ Gravel/stone particles Fine Aggregate kg/m³ Sand particles Age Days Curing duration (1–365 days) Compressive Strength (Output) MPa Target variable to predict Compressive strength values range from approximately 2.33 MPa to 82.60 MPa, with a mean of 35.82 MPa, representing a wide spectrum from low-grade to high-performance concrete. 2
Table 1 (Page 2)
| Feature | Unit | Description | | --- | --- | --- | | Cement | kg/m³ | Primary binding material | | Blast Furnace Slag | kg/m³ | Industrial by-product additive | | Fly Ash | kg/m³ | Coal combustion by-product | | Water | kg/m³ | Water content of mix | | Superplasticizer | kg/m³ | Chemical workability enhancer | | Coarse Aggregate | kg/m³ | Gravel/stone particles | | Fine Aggregate | kg/m³ | Sand particles | | Age | Days | Curing duration (1–365 days) | | Compressive Strength (Output) | MPa | Target variable to predict |
Page 3
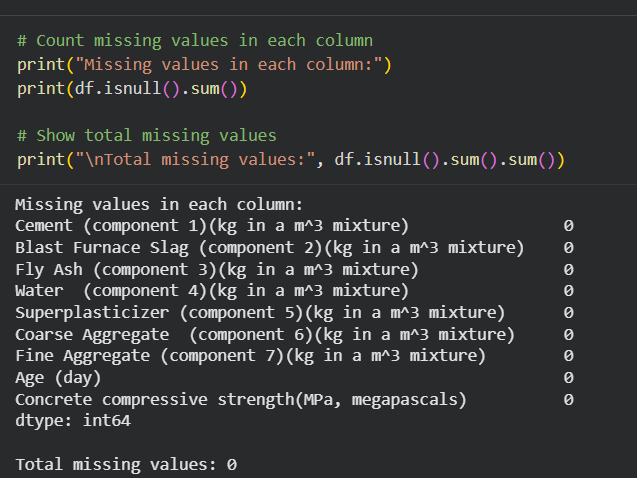
Figure 1 Description of Data 3. Data Preprocessing Methods The following preprocessing steps were applied before model training: 3.1 Missing Value Check All 1,030 samples were checked for missing values. No missing values were found across any of the 9 columns, confirming the dataset was complete and required no imputation. Figure 2 Missing Value Check 3.2 Feature and Target Separation The dataset was divided into input features (X) containing all 8 ingredient columns, and the target variable (y) containing concrete compressive strength. This separation is essential for supervised machine learning. 3
Page 4
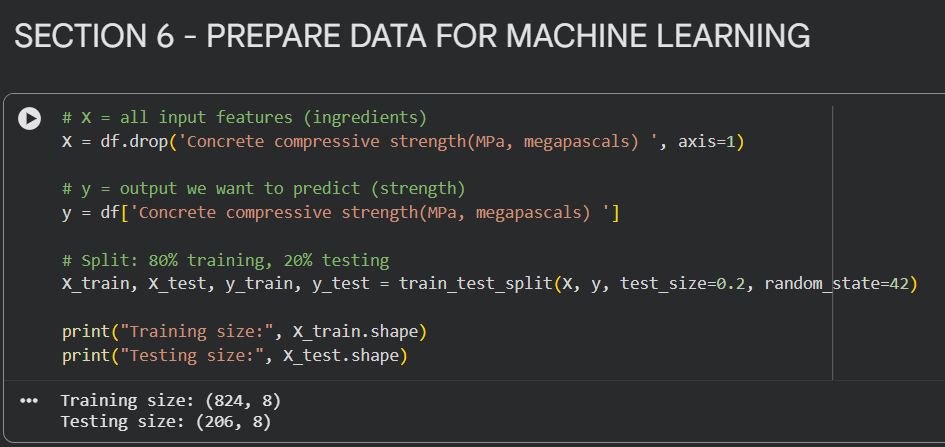
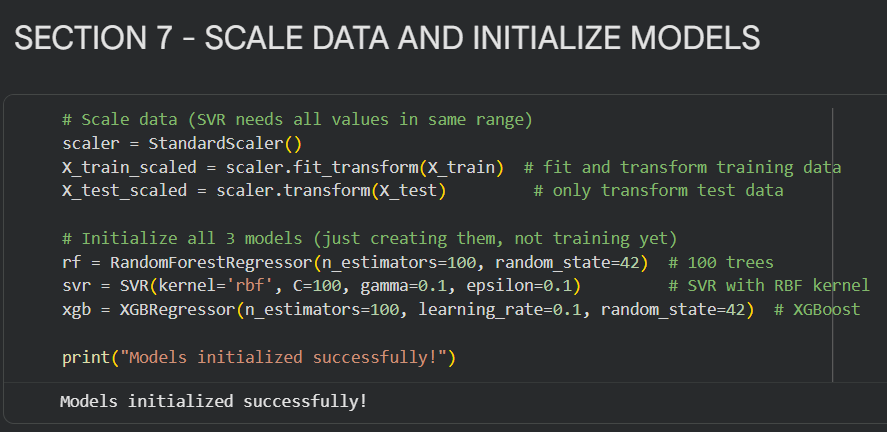
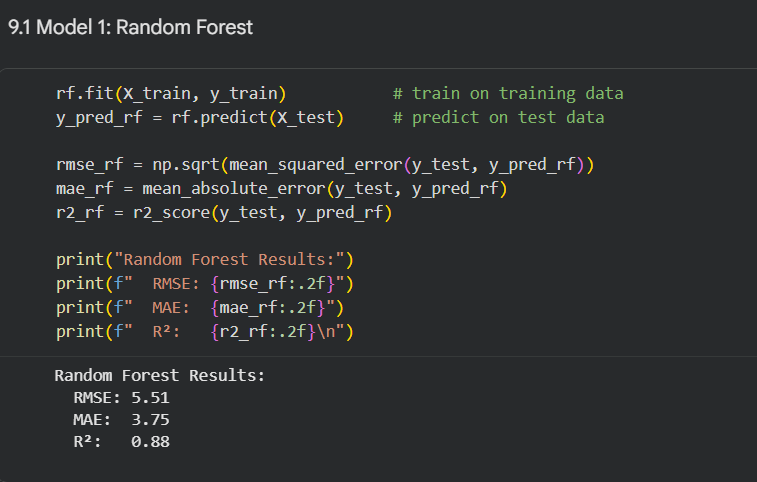
3.3 Train-Test Split The dataset was split into 80% training data (824 samples) and 20% testing data (206 samples) using a fixed random state of 42 to ensure reproducibility. The training set was used for model learning, and the test set was held out for final evaluation. Figure 3 Feature and Target Separation with Data Split 3.4 Feature Scaling StandardScaler was applied to normalize all input features for the SVR model. This is necessary because SVR is sensitive to differences in feature magnitude. The scaler was fitted exclusively on training data and applied to both training and test data to prevent data leakage. Random Forest and XGBoost do not require feature scaling. Figure 4 Feature Scaling for SVR Model and Initializing Three Models 4. Machine Learning Methods Used 4.1 Random Forest Regressor Random Forest is an ensemble learning method that constructs multiple decision trees during training and averages their predictions. Each tree is built on a random subset of training data and features, which reduces overfitting and improves generalization. The model was initialized with 100 trees (n_estimators=100). 4
Page 5
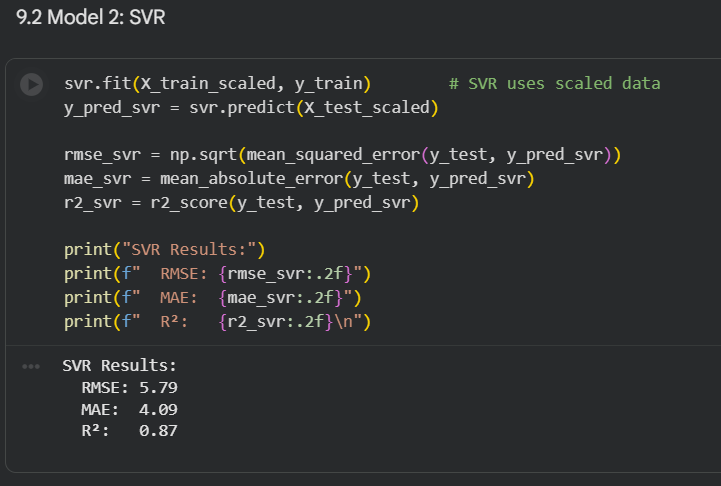
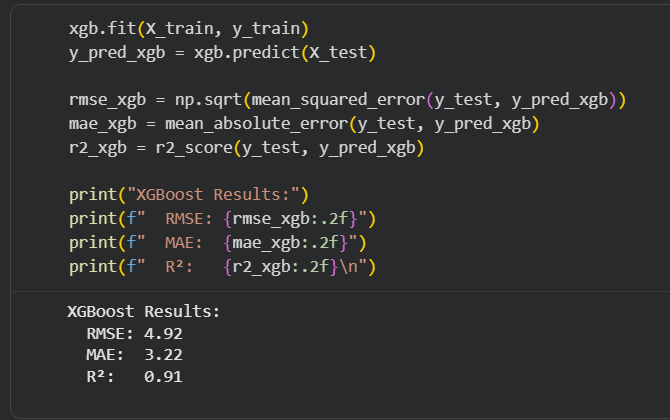
Random Forest inherently provides feature importance scores based on how frequently and effectively each feature is used for splitting across all trees. Figure 5 Code for Random Forest Model Training 4.2 Support Vector Regression (SVR) SVR extends Support Vector Machines to regression tasks. The RBF (Radial Basis Function) kernel was used, which maps input features into a higher-dimensional space enabling the model to capture non-linear relationships. SVR requires feature scaling and its feature importance was determined using permutation importance. Figure 6 Code for SVR Model Training 4.3 XGBoost Regressor XGBoost (Extreme Gradient Boosting) is an advanced ensemble method that builds trees sequentially, with each tree correcting the errors of the previous one. It can also incorporate regularization parameters (reg_alpha, reg_lambda) to prevent overfitting and is known for achieving high accuracy on structured datasets. XGBoost was initialized with 100 estimators and a learning rate of 0.1. 5
Page 6
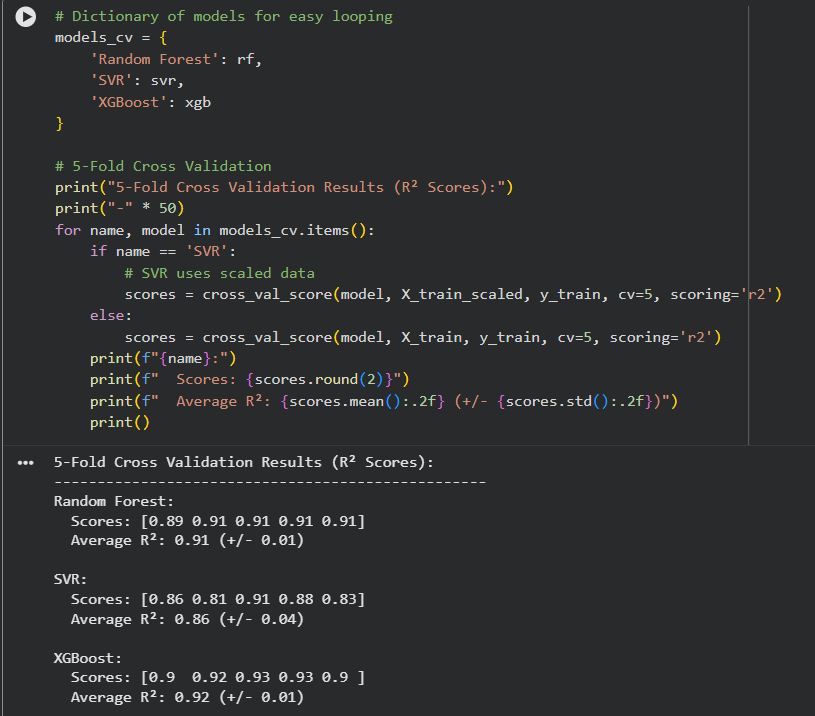
Figure 7 Code for SVR Model Training 5. Model Training and Testing Procedures 5.1 5-Fold Cross Validation Before final training, 5-fold cross-validation was performed on all three models using the training data only. The training set was divided into 5 equal parts. In each round, 4 parts were used for training and 1 part for validation, rotating until each part had served as the validation set. The average R² score across all 5 folds was used to assess model reliability. Cross-validation results confirmed consistent performance across folds, with XGBoost achieving an average R² of 0.92 (±0.01), Random Forest 0.91 (±0.01), and SVR 0.86 (±0.04). Figure 8 K-Fold Cross Validation (5-Fold) 6
Page 7
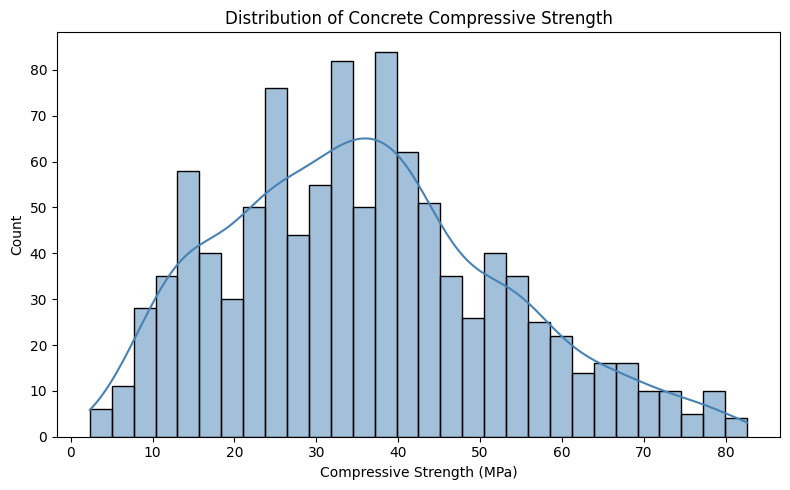
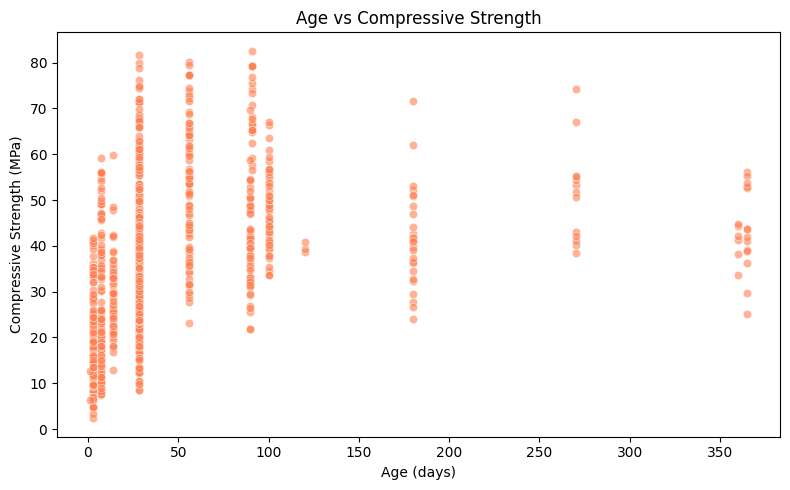
5.2 Model Training All three models were initially trained with default parameters on the 824-sample training set and evaluated on the 206-sample test set, 80-20 split. 6. Exploratory Data Analysis The following visualizations were generated using the python notebook: • Distribution of Concrete Compressive Strength, histogram showing most samples fall between 25–45 MPa Figure 9 Distribution of Concrete Compressive Strength • Age vs Strength Scatter Plot, showing strength increase with curing age Figure 10 Age vs Strength Scatter Plot 7
Page 8
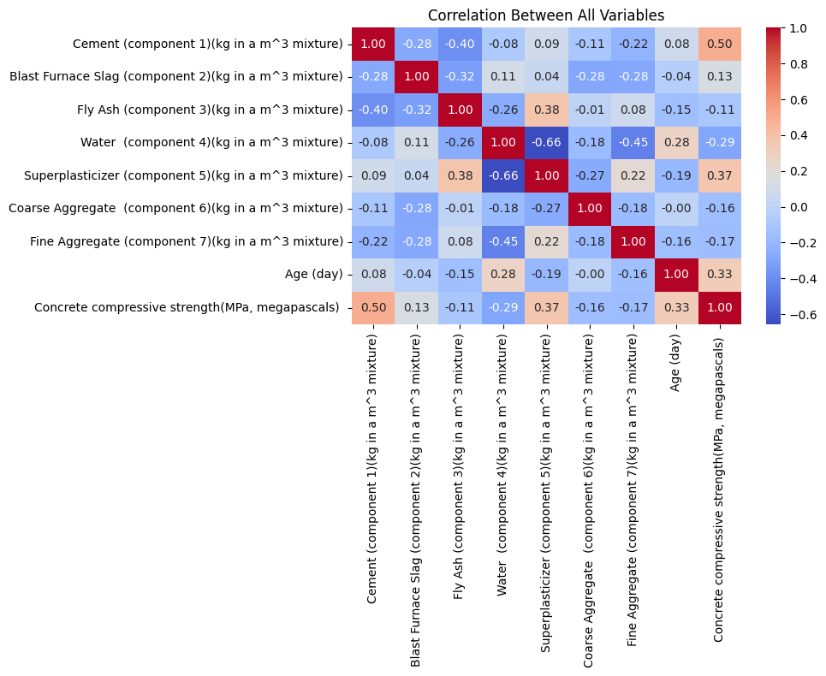
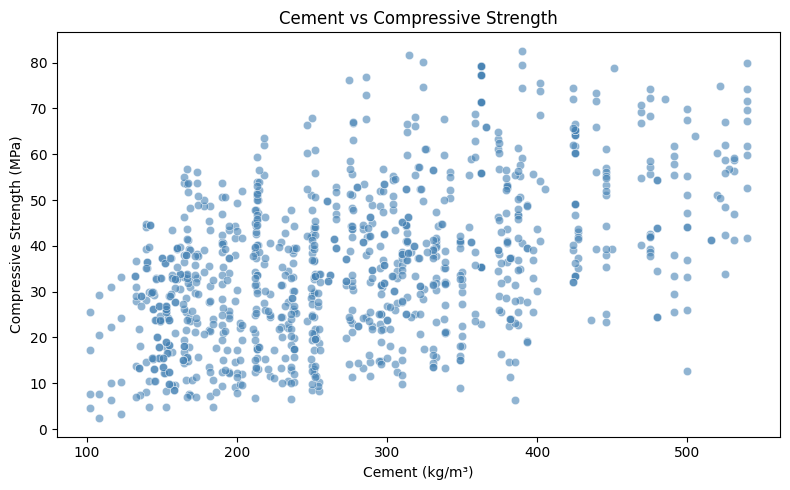
• Correlation Heatmap, showing Cement (0.50) and Age (0.33) as most positively correlated with strength, Water (-0.29) as most negatively correlated Figure 11 Correlation Heatmap Between Parameters • Cement vs Strength Scatter Plot, confirming positive relationship between cement content and strength Figure 12 Cement vs Strength Scatter Plot 8
Page 9
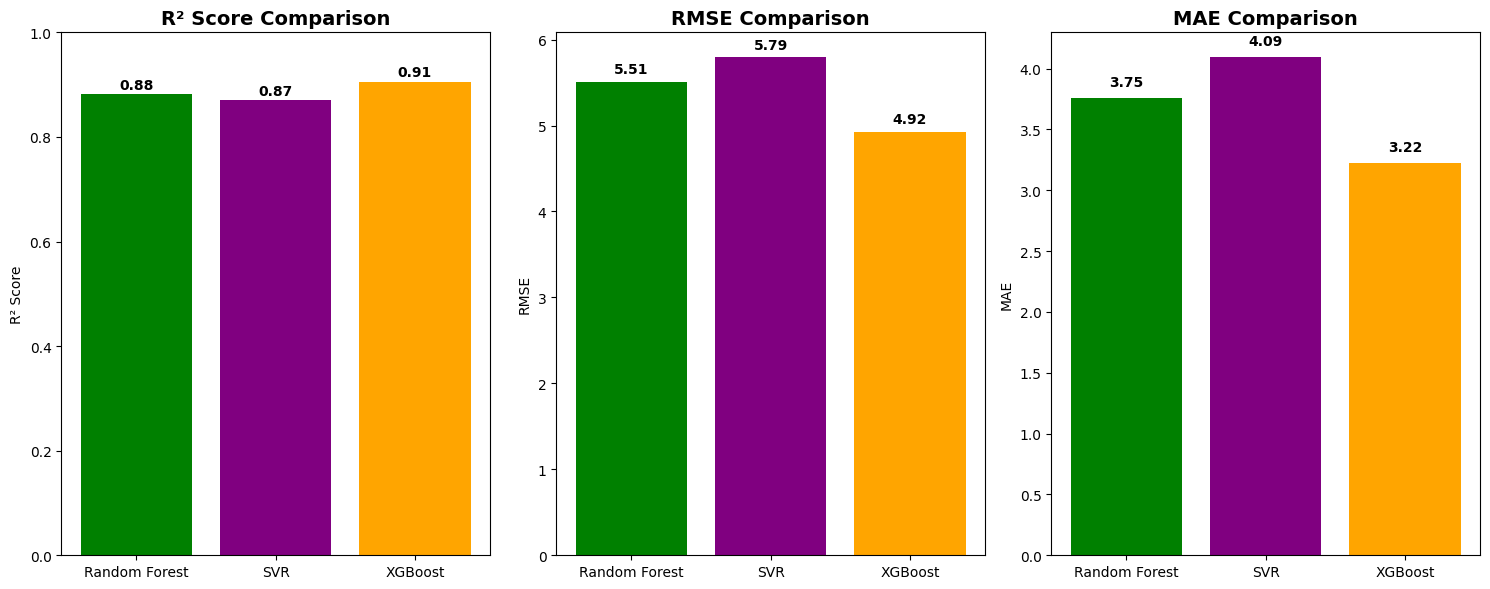
- Performance Evaluation Metrics Three standard regression metrics were used to evaluate model performance: 7.1 Root Mean Square Error (RMSE) RMSE measures the average prediction error in MPa. Lower RMSE indicates better accuracy. It penalizes larger errors more heavily than small ones, making it useful for identifying models that make occasional large mistakes. 7.2 Mean Absolute Error (MAE) MAE measures the average absolute difference between predicted and actual values in MPa. It provides a straightforward interpretation of average prediction error without amplifying large errors. 7.3 R² Score (Coefficient of Determination) R² measures the proportion of variance in compressive strength explained by the model. A value of 1.0 represents perfect prediction while 0 represents no predictive power. An R² of 0.91 means the model explains 91% of the variation in concrete strength. 7.4 Cross-Validation Results Model CV Scores (5 Folds) Average R² Std Dev Random Forest [0.89, 0.91, 0.91, 0.91, 0.91] 0.91 ±0.01 SVR [0.86, 0.81, 0.91, 0.88, 0.83] 0.86 ±0.04 XGBoost [0.90, 0.92, 0.93, 0.93, 0.90] 0.92 ±0.01 XGBoost and Random Forest showed the lowest variance across folds (±0.01), indicating highly consistent and reliable performance. SVR showed slightly higher variance (±0.04) suggesting sensitivity to data partitioning. 7.5 Model Performance All models showed good comparable performance. The results are presented below: Model RMSE MAE R² XGBoost 4.92 3.22 0.91 Random Forest 5.51 3.75 0.88 SVR 5.79 4.09 0.87 9
Table 1 (Page 9)
| Model | CV Scores (5 Folds) | Average R² | Std Dev | | --- | --- | --- | --- | | Random Forest | [0.89, 0.91, 0.91, 0.91, 0.91] | 0.91 | ±0.01 | | SVR | [0.86, 0.81, 0.91, 0.88, 0.83] | 0.86 | ±0.04 | | XGBoost | [0.90, 0.92, 0.93, 0.93, 0.90] | 0.92 | ±0.01 |
Table 2 (Page 9)
| Model | RMSE | MAE | R² | | --- | --- | --- | --- | | XGBoost | 4.92 | 3.22 | 0.91 | | Random Forest | 5.51 | 3.75 | 0.88 | | SVR | 5.79 | 4.09 | 0.87 |
Page 10
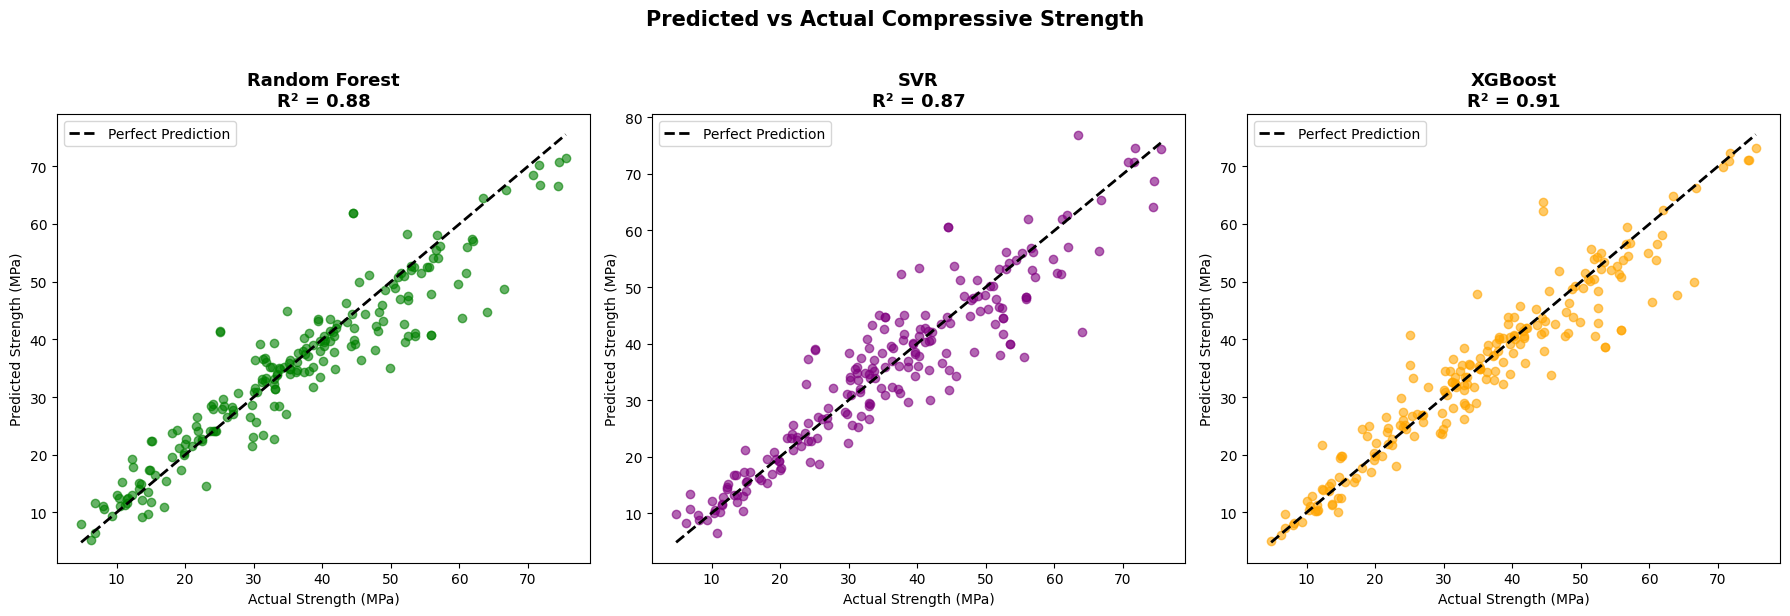
• R², RMSE, and MAE Comparison Bar Charts, comparing all three models Figure 13 Comparison of R², RMSE, and MAE • Predicted vs Actual plots with ±RMSE error bands for all three models Figure 14 Predicted Vs Actual Compressive Strength XGBoost consistently achieved the highest R² and lowest error metrics on the UCI test dataset, benefiting from its sequential error-correction learning approach and regularization. Random Forest performed as a strong second, offering reliable and consistent predictions. SVR, while slightly less accurate, demonstrated excellent generalization characteristics especially when properly tuned. 10
Page 11
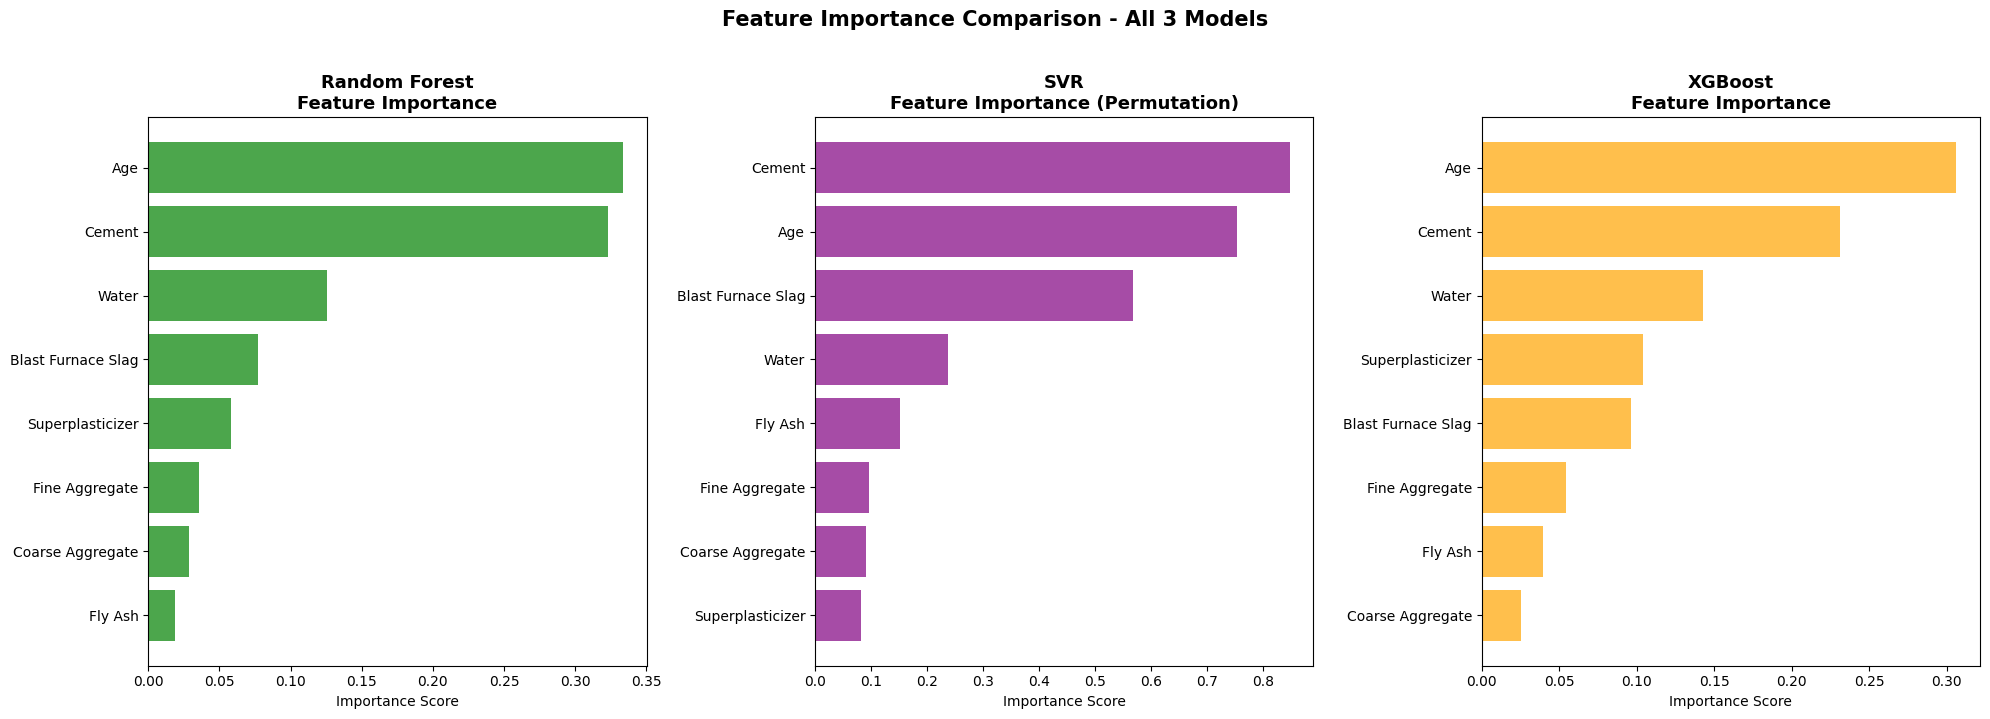
- Engineering Interpretation and Discussion 8.1 Feature Importance Analysis Feature importance analysis revealed that Age and Cement are the two most influential factors across all three models, which aligns strongly with established civil engineering knowledge: • Age (Importance: about 0.30 in XGBoost) , Concrete gains strength through a chemical hydration process over time. Standard testing at 28 days is a widely accepted benchmark in structural engineering. • Cement (Importance: 0.23 in XGBoost) , As the primary binding material, higher cement content directly increases strength through the hydration reaction. • Water (Importance: 0.14 in XGBoost) , The water-to-cement ratio is a fundamental parameter in concrete design. Higher water content reduces strength by increasing porosity. • Superplasticizer , Improves workability without adding water, enabling lower water-cement ratios and thus higher strength. • Coarse and Fine Aggregate , Contribute to the structural skeleton of concrete but have lower direct influence on compressive strength. An interesting finding is that different models ranked Age and Cement differently. The correlation heatmap indicated Cement had the highest linear correlation (0.50) with strength, while XGBoost's tree-based importance ranked Age highest (0.30). This discrepancy arises because correlation measures linear relationships while tree-based importance captures non-linear predictive power. Both Age and Cement consistently appeared in the top two features across all models, confirming their engineering significance. Figure 15 Feature Importance 11
Page 12
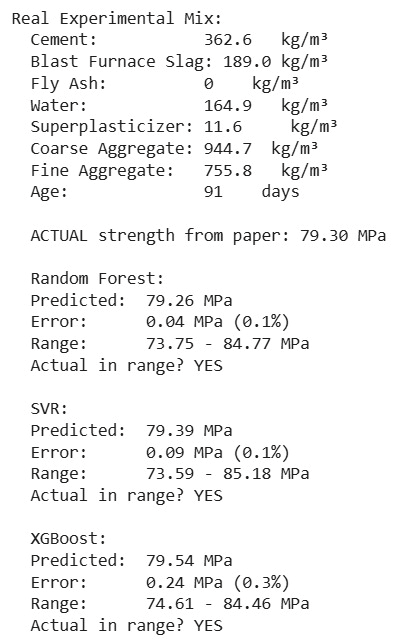
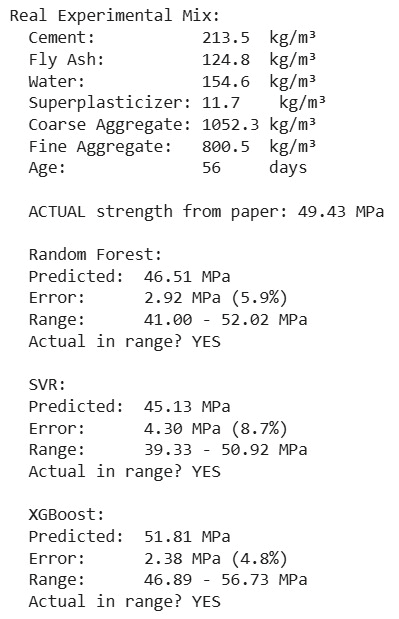
8.2 Real-World Validation To validate model performance beyond the UCI dataset, predictions were compared against experimental data from a published research paper: H. Song et al. (2021) reported experimental compressive strength data for fly ash concrete. One real mix from the study was selected for validation because its proportions were within the UCI dataset feature ranges. The actual strength was 49.43 MPa. The Random Forest, SVR, and XGBoost models predicted 46.51 MPa, 45.13 MPa, and 51.81 MPa, respectively. All three predictions included the actual value within their predicted ranges. XGBoost gave the closest result, with the lowest error of 2.38 MPa, showing the best performance for this validation case. Figure 16 Validation 1 Results Figure 17: Validation 2 Results For Validation 2, one sample from the UCI dataset was entered into the trained models to check how well they learned from the data. The actual strength was 79.30 MPa. Random Forest, SVR, and XGBoost predicted 79.26 MPa, 79.39 MPa, and 79.54 MPa, respectively. All predictions were very close to the actual value, confirming strong model performance on dataset-based validation. These validation results highlight a fundamental machine learning principle: while XGBoost achieved the highest test accuracy on the UCI dataset, and superior generalization to real-world unseen mixes. For critical structural engineering applications, multiple model predictions should be considered alongside laboratory testing. 12
Page 13
- Conclusions This project successfully developed and evaluated three machine learning models for predicting concrete compressive strength. The following key conclusions are drawn: • All three models achieved strong predictive performance with R² values exceeding 0.87, demonstrating the suitability of machine learning for concrete strength prediction. • XGBoost achieved the highest R² of approximately 0.91on the UCI test dataset, outperforming Random Forest and SVR on standard evaluation metrics. • 5-fold cross-validation confirmed model reliability with XGBoost and Random Forest showing the lowest variance (±0.01), indicating consistent generalization. • Feature importance analysis consistently identified Age and Cement as the two most influential predictors across all models, validating established civil engineering knowledge. • Real-world validation against Song et al. (2021) showed good model performance, with XGBoost having the lowest error of 4.8%, followed by Random Forest at 5.9% and SVR at 8.7%. • Dataset-based validation showed that all models predicted very close to the actual strength, with Random Forest, SVR, and XGBoost errors of 0.1%, 0.1%, and 0.3%, respectively, highlighting that model error decreases when the test data is similar to the training data. This project demonstrates that machine learning, particularly ensemble methods like Random Forest, XGBoost and SVR, offers a powerful tool for concrete strength prediction in civil engineering applications, with the potential to significantly reduce laboratory testing time and material costs during the concrete mix design process.
- References [1] Yeh, I.C. (1998). Modeling of strength of high-performance concrete using artificial neural networks. Cement and Concrete Research, 28(12), 1797–1808. [2] UCI Machine Learning Repository. Concrete Compressive Strength Dataset. Available at: https://archive.ics.uci.edu/ml/datasets/concrete+compressive+strength [3] Song, H., Ahmad, A., Farooq, F., Ostrowski, K.A., Maslak, M., Czarnecki, S., & Aslam, F. (2021). Predicting the compressive strength of concrete with fly ash admixture using machine learning algorithms. Construction and Building Materials, 308, 125021. [4] Scientific Reports , Nature (2025). Optimizing sustainable blended concrete mixes using deep learning and multi-objective optimization. Nature Publishing Group. [5] Scikit-learn Documentation. RandomForestRegressor, SVR, GridSearchCV. Available at: https://scikit- learn.org [6] XGBoost Documentation. XGBRegressor. Available at: https://xgboost.readthedocs.io 13
UCI Concrete Compressive Strength Dataset