Page 1
Comparative Finite Element Analysis and Optimization of 2D Truss Bridge Configurations Prepared By: Sabin Khatri COURSE INSTRUCTOR Dr. Edward Hall Course: MEMT 508 Institution: Louisiana Tech University Date: May 15th, 2026


Page 2
Contents Summary .................................................................................................................. 3
- Project Description ................................................................................................ 3 1.1 Introduction ..................................................................................................... 3 1.2 Problem Statement ........................................................................................... 3 1.3 Truss Geometry ................................................................................................ 4
- Model and Boundary Conditions ............................................................................. 4 2.1 Type of Analysis ................................................................................................ 4 2.2 Material Properties ........................................................................................... 4 2.3 Cross-Sectional Properties ................................................................................ 5 2.4 Boundary Conditions ........................................................................................ 5 2.5 Loading Conditions ........................................................................................... 6 2.6 Mesh ............................................................................................................... 6 2.7 Modeling Considerations .................................................................................. 6
- Results .................................................................................................................. 7 3.1 Pratt Truss Results ............................................................................................ 7 3.2 Warren Truss Results ...................................................................................... 10 3.3 Howe Truss Results ......................................................................................... 13 3.4 Comparative Analysis ..................................................................................... 16 3.5 Analytical Comparison .................................................................................... 17
- References .......................................................................................................... 19 2
Page 3
Summary The project analyzes the structure and efficiency of three typical types of two-dimensional truss bridges: Pratt truss bridge, Warren truss bridge, and Howe truss bridge. The structures were analyzed using finite element method through SolidWorks simulation to examine their stress analysis, displacement, factor of safety, and structure mass under identical loads and boundary conditions. The three bridges were created using beam elements with the same geometric shapes, materials, and load conditions. After conducting comparative analyses, the bridge structure that showed maximum efficiency in distributing load and minimum stress concentration was optimized to minimize the structural mass. This was done by varying cross-section sizes and dimensions while maintaining desirable levels of stresses and displacements.
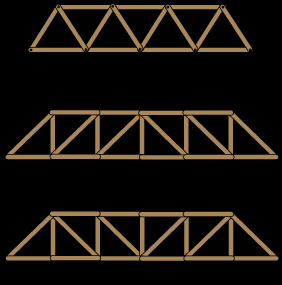
- Project Description 1.1 Introduction The truss bridge system is one of the most common bridge types applied in civil engineering due to its efficiency in transferring loads without adding to much weight to the structure. Each truss design transfers forces in a unique manner depending on how the truss members are configured and oriented. This project compares three common truss bridge configurations: • Pratt Truss • Warren Truss • Howe Truss Finite element analysis was used to evaluate the stress distribution, displacement behavior, and overall structural efficiency of each truss under identical loading conditions. 1.2 Problem Statement The purpose of this project is to determine how truss geometry affects structural performance under static loading conditions. Each truss was modeled with the same span length, truss height, loading conditions, support conditions, and material properties so that the structural response of each configuration could be directly compared. 3
Page 4
1.3 Truss Geometry The following geometric parameters were used for all truss configurations: Parameter Value Total Span Length 12m Truss Height 1.5 m Number of Panels 6 Panel Length 2m 2. Model and Boundary Conditions 2.1 Type of Analysis The static structural analysis was conducted using SolidWorks Simulation. Beams were used to model trusses since they are computationally inexpensive, and their use is appropriate when dealing with slender structural members that are subjected mainly to axial loads. Gravity loads and joint loads have been considered in the analysis. 2.2 Material Properties All truss members were assigned the same material properties to ensure a fair comparison between configurations. 4
Table 1 (Page 4)
| Parameter | Value | | --- | --- | | Total Span Length | 12m |
Page 5
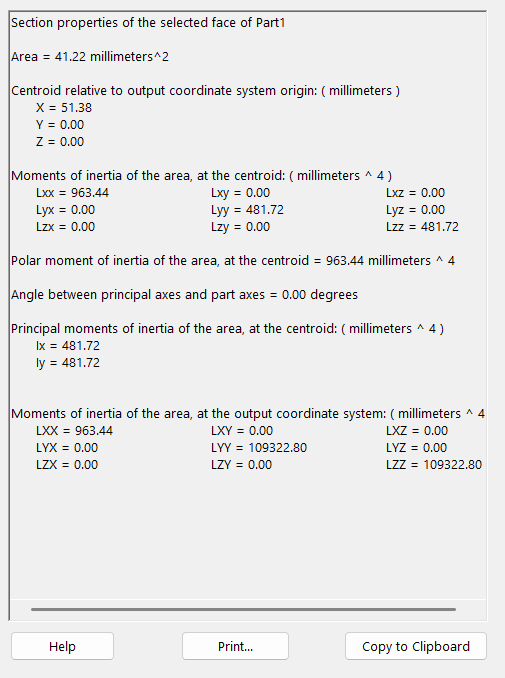
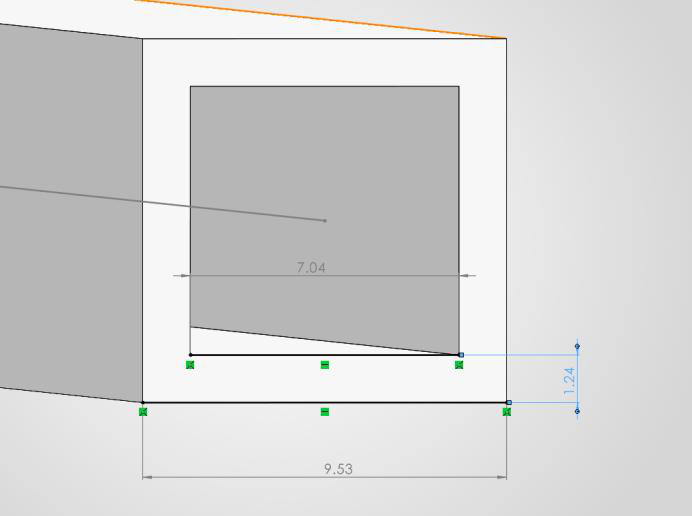
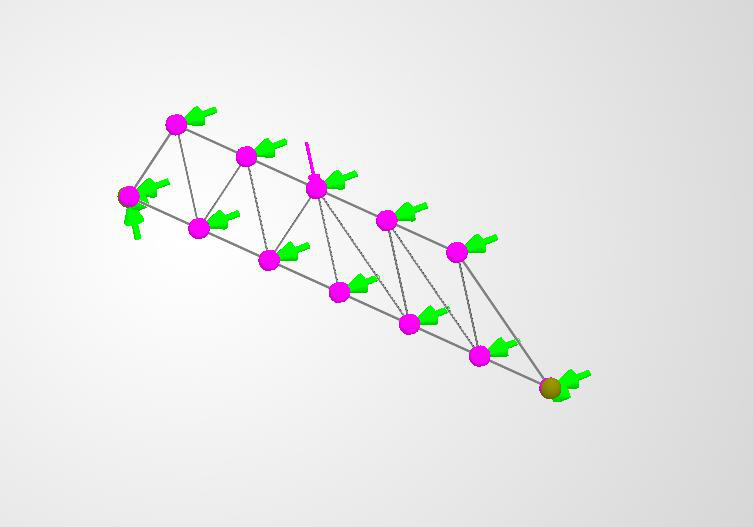
Material used: • Alloy Steel Material properties: Property Value Elastic Modulus 210 GPa Poisson’s Ratio 0.28 Yield Strength 620 MPa Density 7700 kg/m³ 2.3 Cross-Sectional Properties Square hollow steel pipe sections were used for the truss members of same dimensions throughout. 2.4 Boundary Conditions The truss bridges were modeled using simply supported boundary conditions. Support conditions: • Left support: pinned support • Right support: roller support 5
Table 1 (Page 5)
| Property | Value | | --- | --- | | Elastic Modulus | 210 GPa |
Page 6
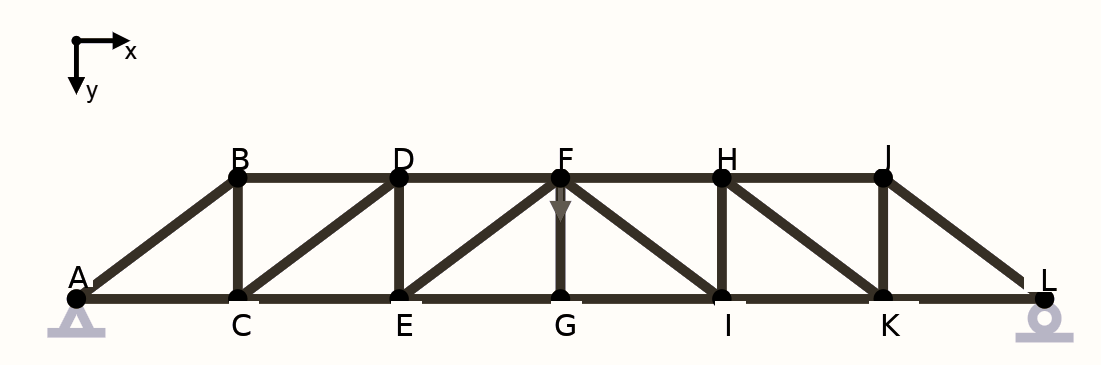
2.5 Loading Conditions The following loading conditions were applied: Concentrated downward joint loads of 1N at the center were applied to obtain the maximum stress, which helped in obtaining the maximum joint load that can be held by the truss, as shown above. The same loading conditions were applied to all truss configurations to ensure a consistent comparison. 2.6 Mesh Beam-element meshing was used for the finite element models. The mesh density was selected to provide stable and accurate stress and displacement results while maintaining computational efficiency. 2.7 Modeling Considerations Several assumptions and modeling considerations were used during the finite element analysis: • Linear elastic material behavior was assumed. • 2D trusses were modelled to simplify the comparison. • The gravity load of the truss itself was ignored. • Truss member connections were idealized. • Beam elements were used instead of solid elements. 6
Page 7
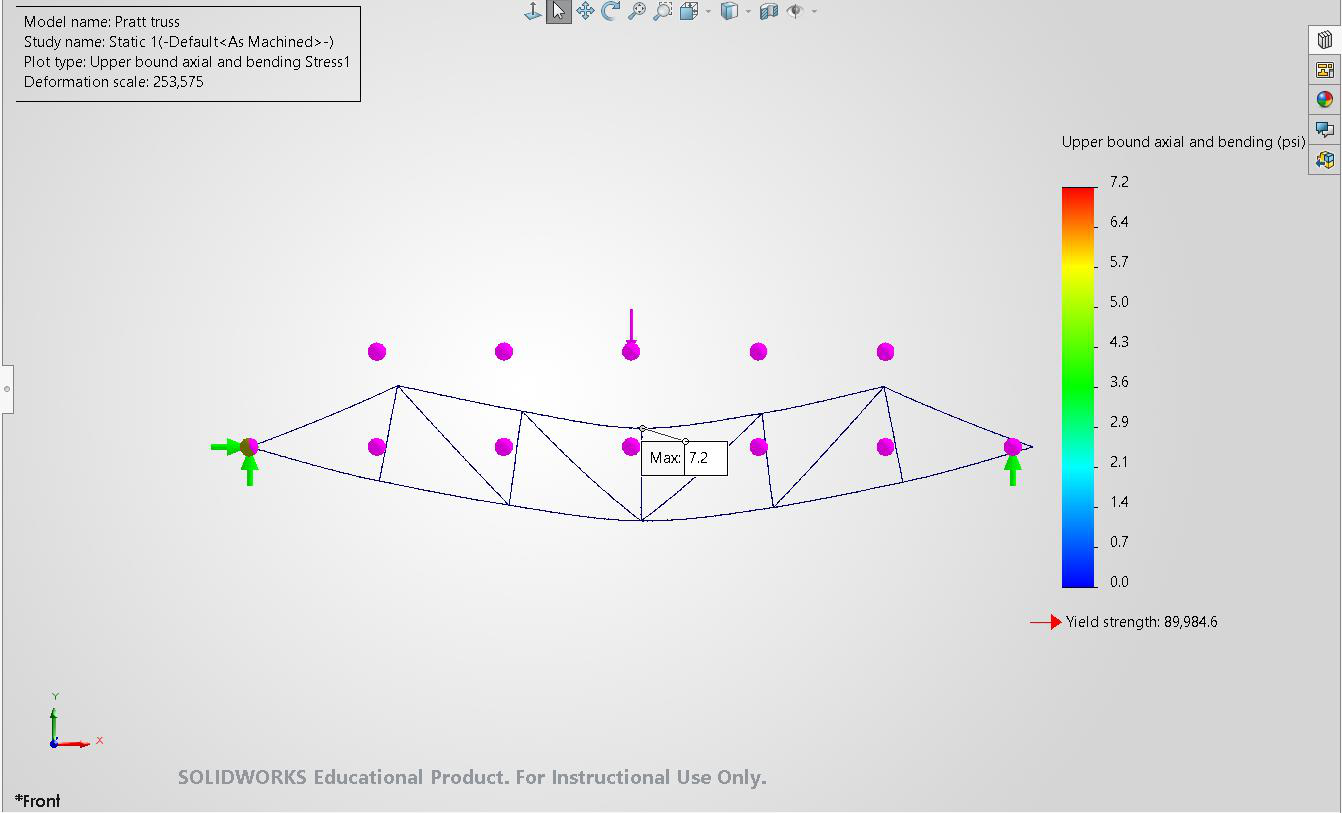
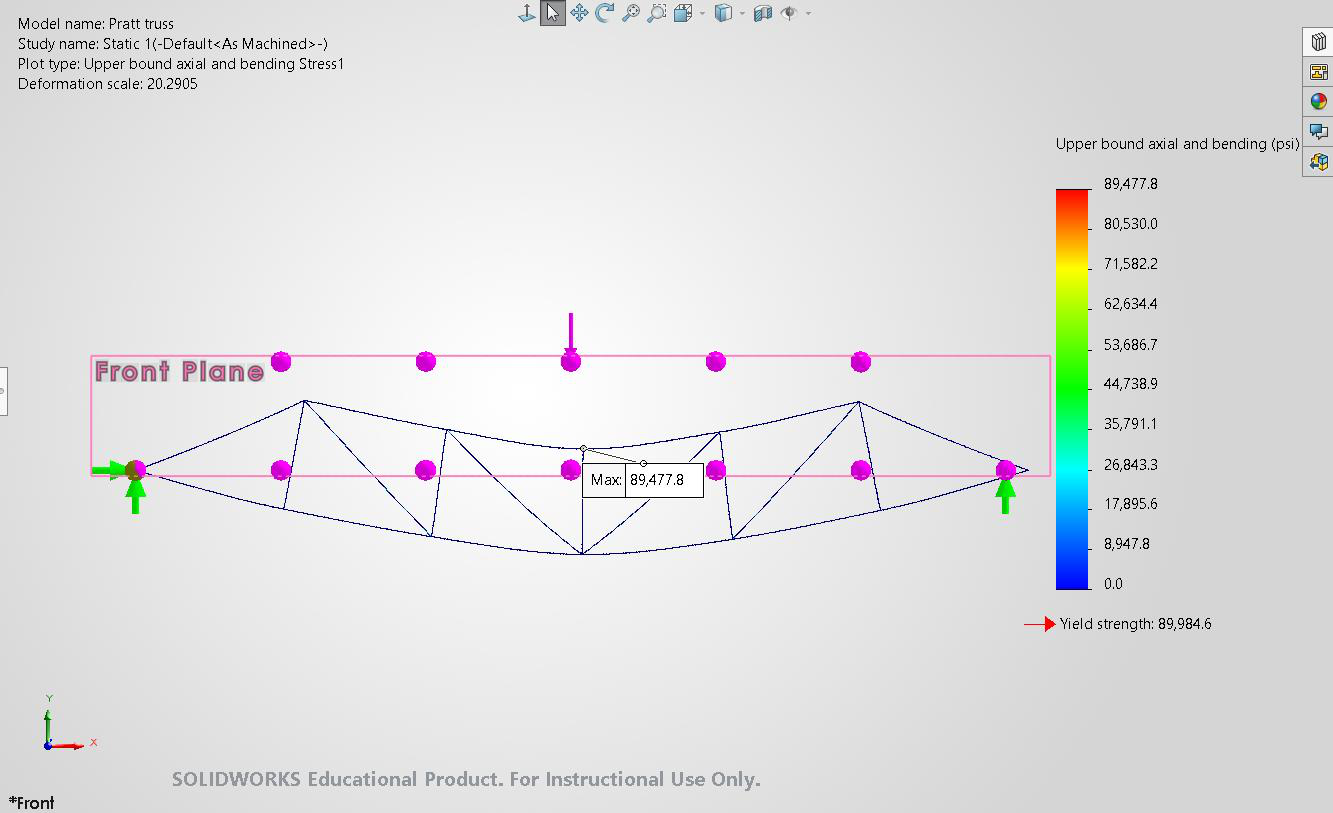
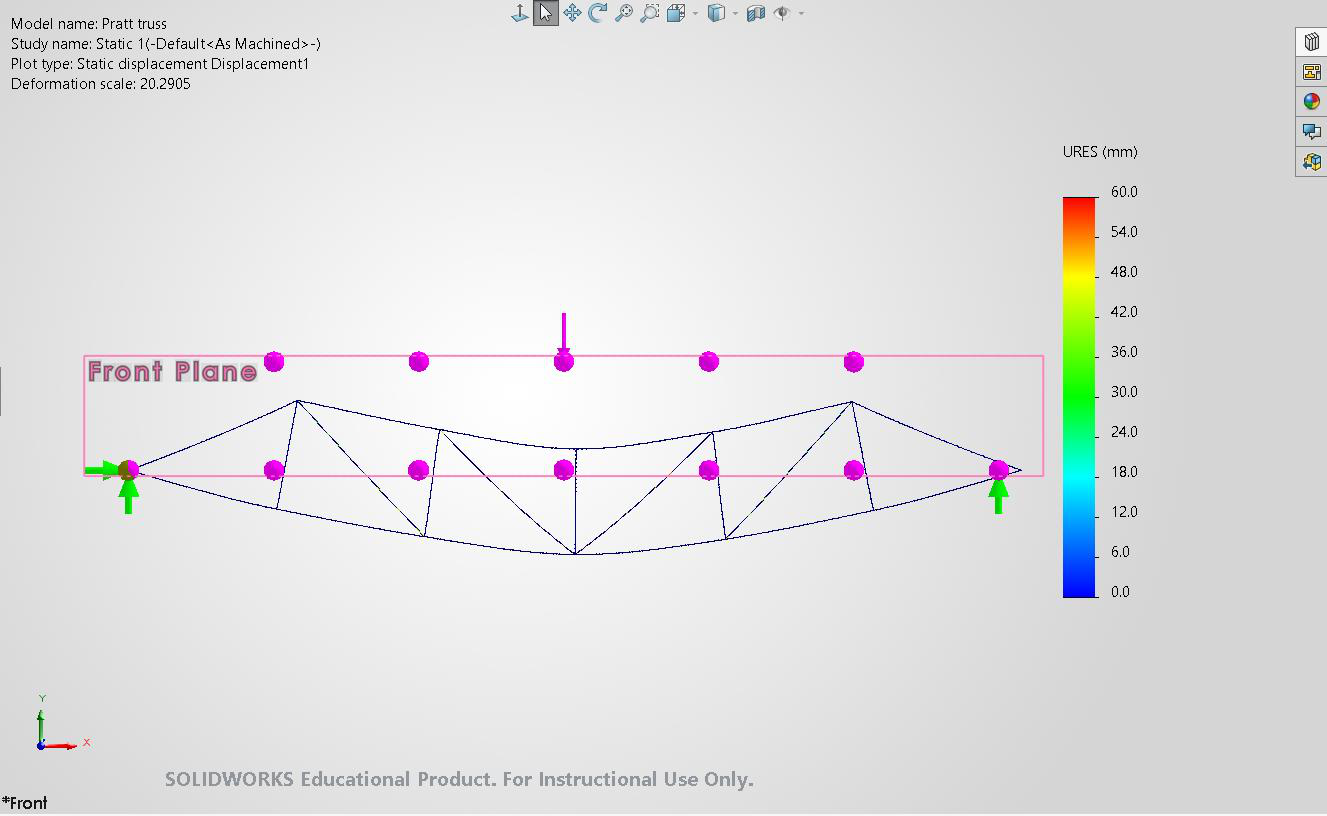
• Small deformation assumptions were applied. • Dynamic effects, wind loads, and seismic loads were not considered. These assumptions simplified the analysis while still providing meaningful structural comparisons between the truss configurations. 3. Results 3.1 Pratt Truss Results At 1N load, The material yield strength is 89,984.6 psi. Since the upper-bound stress is 7.2 psi at 1 N load, the estimated maximum load before yielding is: 89,984.6 / 7.2 = 12,497.86 N So, the structure can hold approximately 12,498 N before yielding. At 12497.86 N, 7
Page 8
8
Page 9
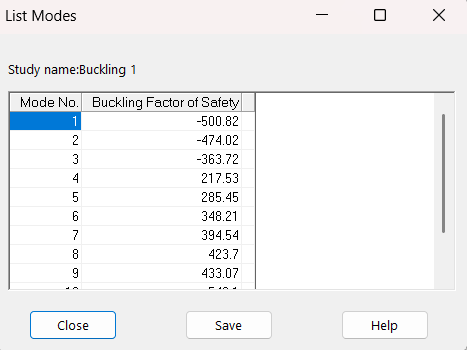
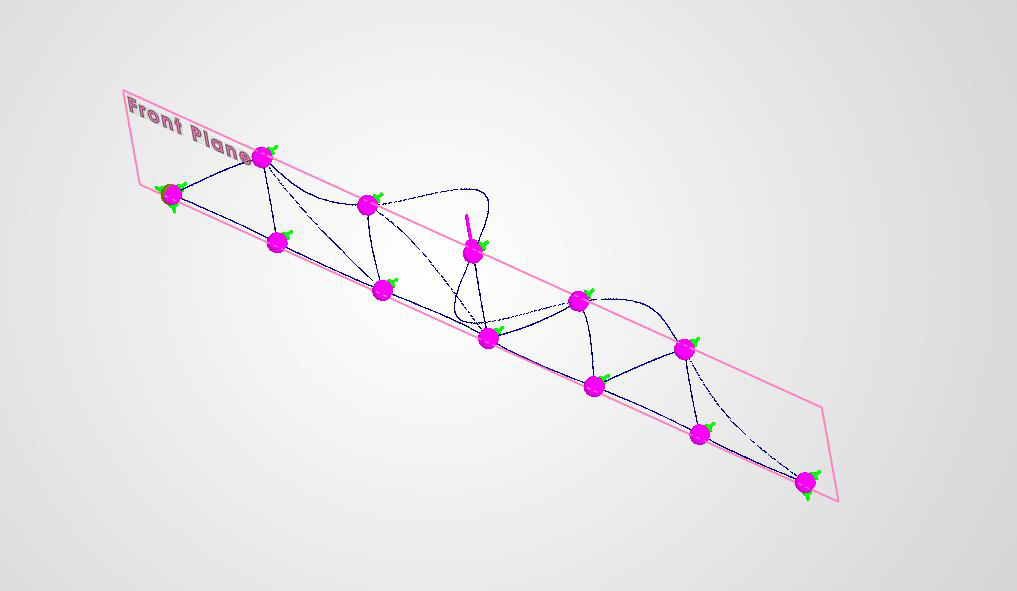
Buckling Analysis of truss: Buckling Analysis of the truss showed that the maximum load it can hold (the 1st positive FOS) was 217.53 N with the above buckling profile. 9
Page 10
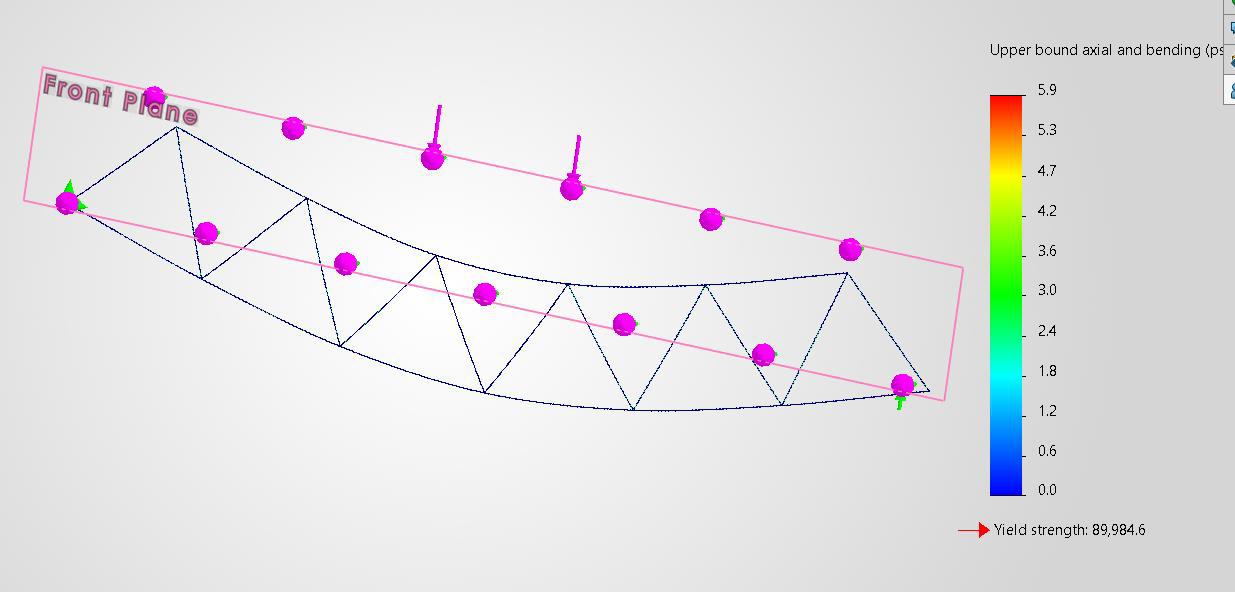
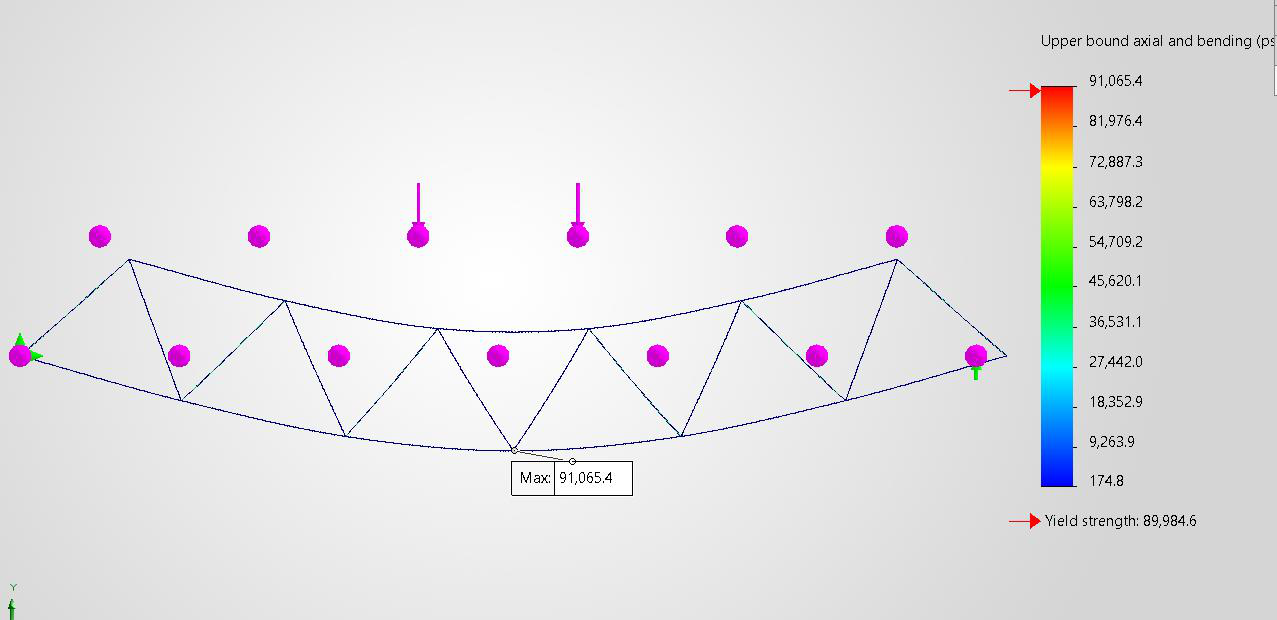
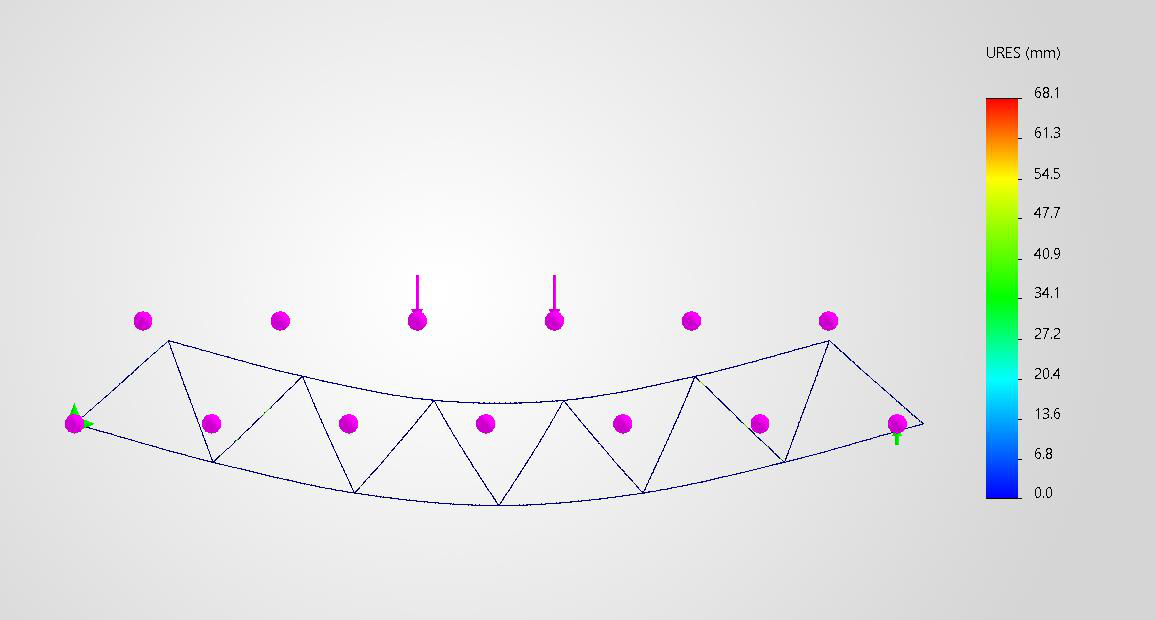
3.2 Warren Truss Results At 1 N load, Since the upper-bound stress is 5.9 psi at 1 N load, the estimated maximum load before yielding is: 89,984.6 / 5.9 = 15251.63 N So, the structure can hold approximately 15251.63 before yielding. At 15251.63N loading, 10
Page 11
11
Page 12
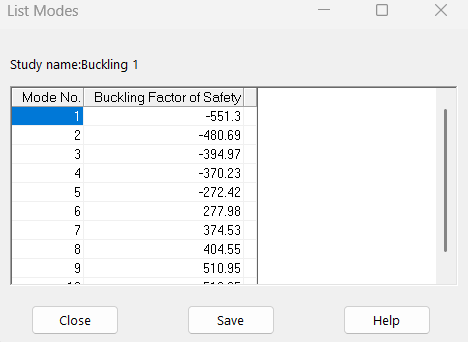
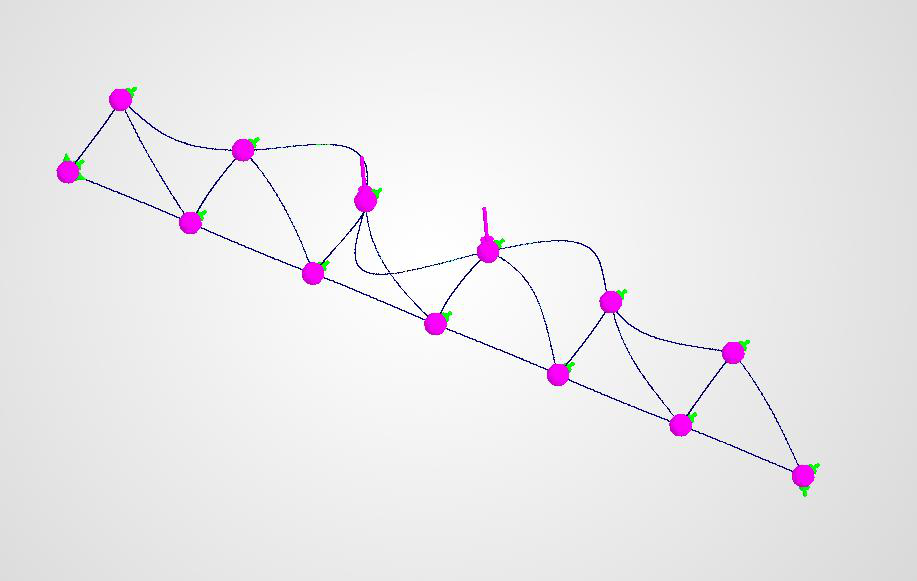
Buckling Analysis: Buckling Analysis of the truss showed that the maximum load it can hold (the 1st positive FOS) was 277.98 N with the above buckling profile. 12
Page 13
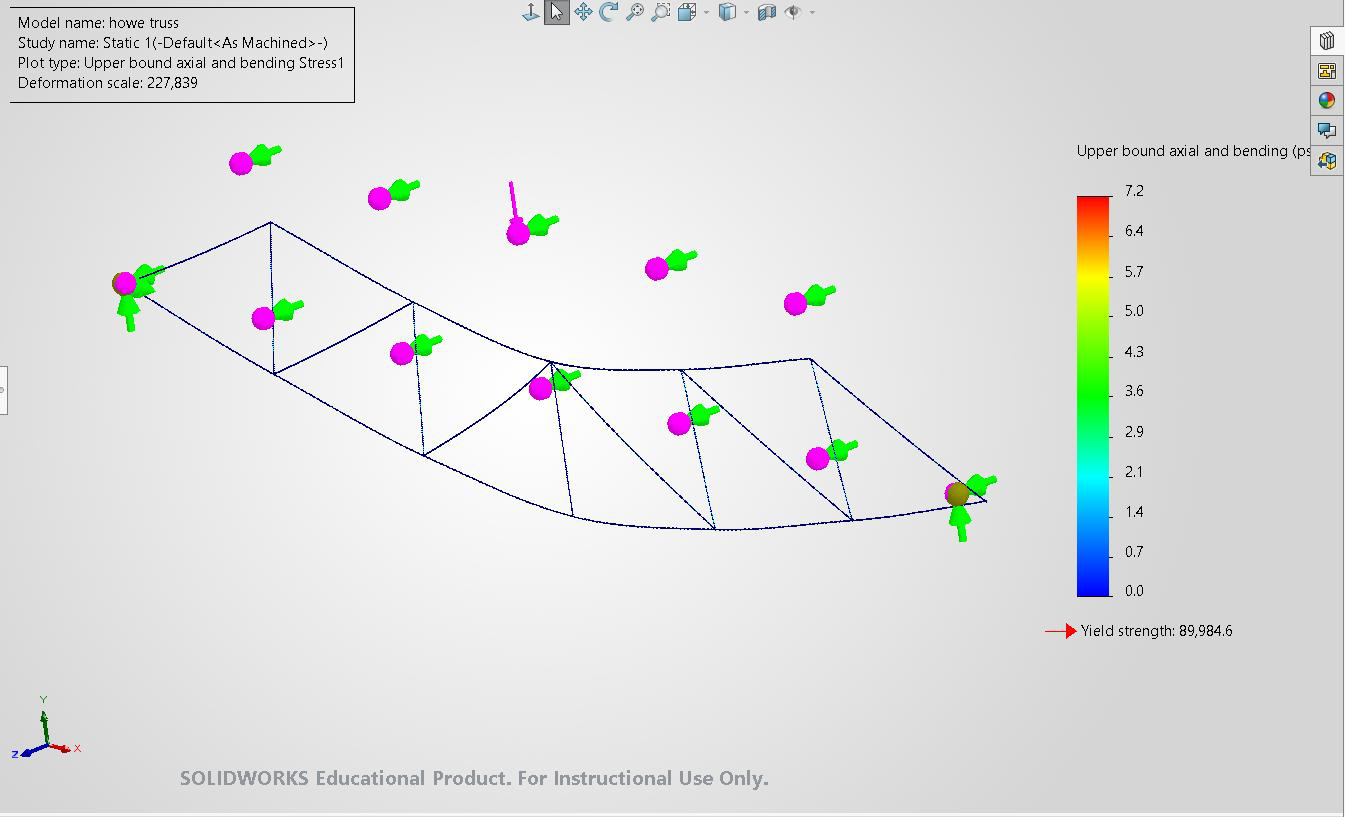
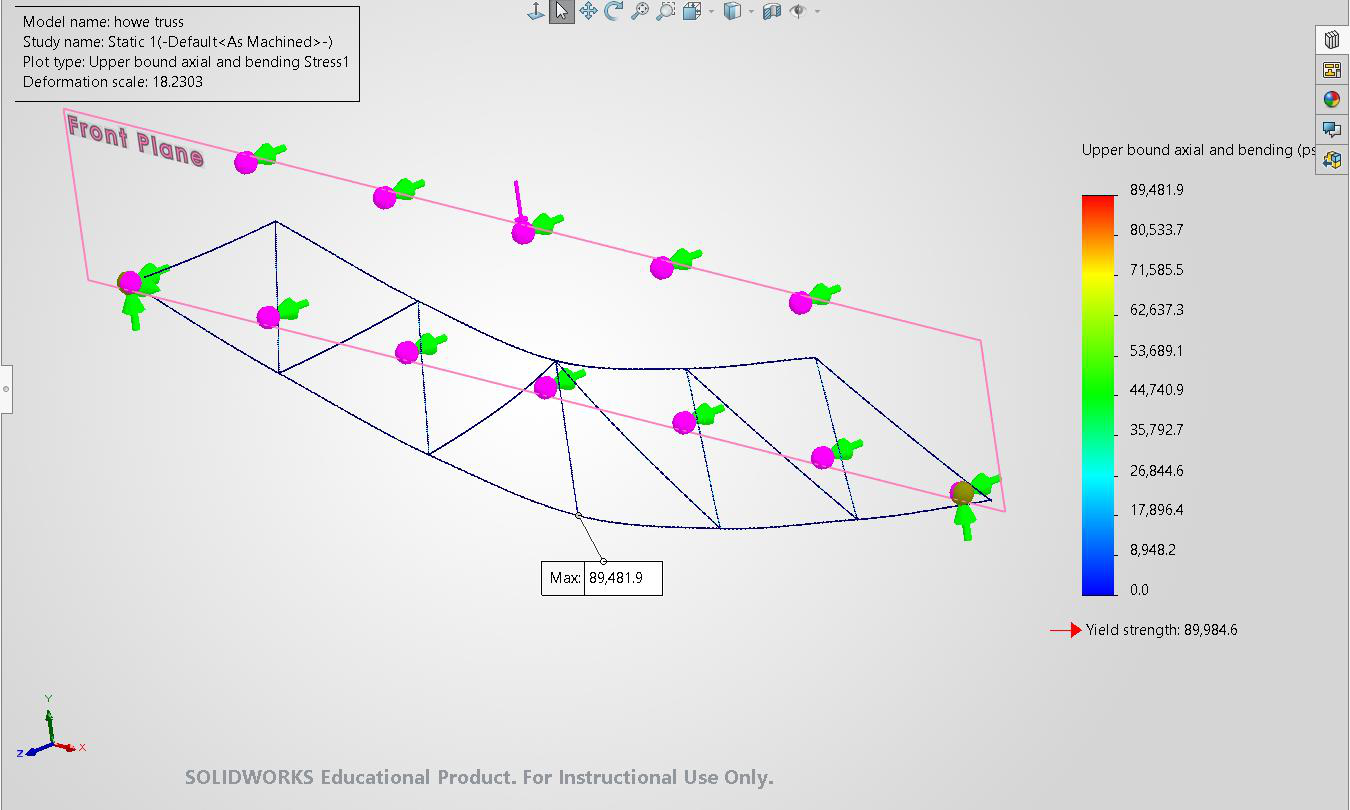
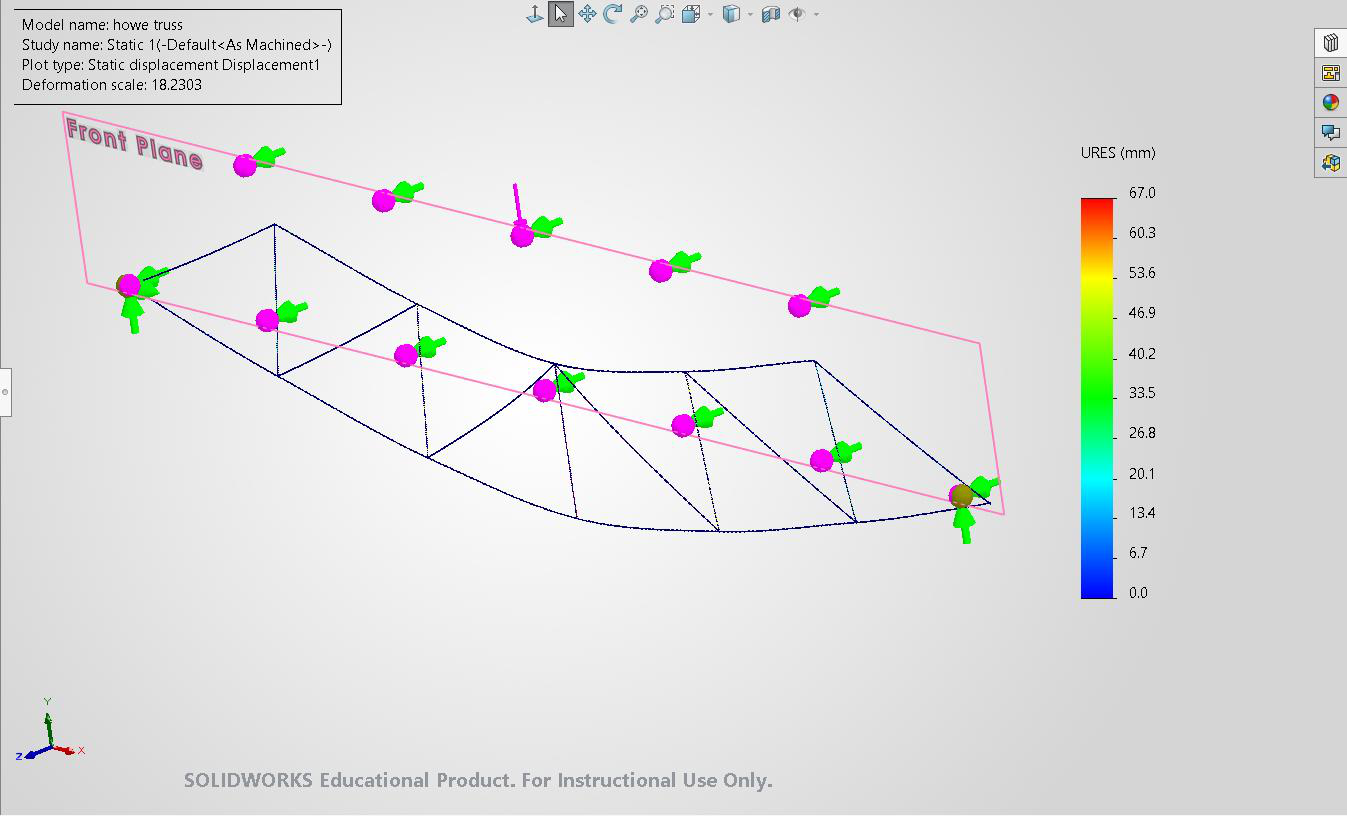
3.3 Howe Truss Results At 1 N load The material yield strength is 89,984.6 psi. Since the upper-bound stress is 7.2 psi at 1 N load, the estimated maximum load before yielding is: 89,984.6 / 7.2 = 12,497.86 N So, the structure can hold approximately 12,498 N before yielding, which is similar to the Pratt Truss load distribution. At 12497.86 N, 13
Page 14
14
Page 15
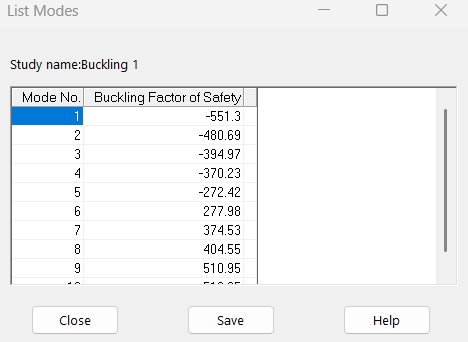
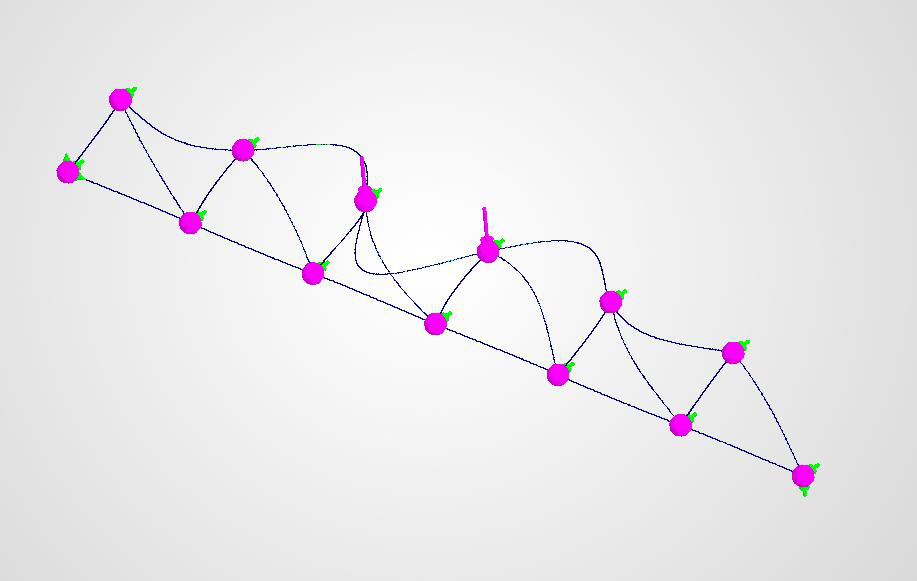
Buckling Analysis: The buckling analysis showed that the truss can hold a load of 277.98N before being unstable. 15
Page 16
3.4 Comparative Analysis The Pratt, Warren, and Howe trusses were analyzed by comparing them using the same material characteristics, span distance, supports, and 1 N loading at the center joint. This made it possible to assess the influence of truss geometry on the stress distribution and structural stability. The yield strength of the material used is alloy steel, which has a yield strength of 89,984.6 psi. Truss Type Upper-Bound Stress at Yield-Based Maximum Buckling Load 1 N Load Pratt Truss 7.2 psi 12,497.86 N 217.53 N Warren 5.9 psi 15,251.63 N 277.98 N Truss Howe Truss 7.2 psi 12,497.86 N 277.98 N From the standpoint of yield-based performance, the Warren truss demonstrated superior results, due to the lowest upper bound stress value of 5.9 psi, which produced the highest estimated yield-based load carrying capability of 15,251.63 N. On the other hand, both Pratt and Howe trusses exhibited the same upper bound stress value of 7.2 psi, which gave rise to the same estimated yield-based load carrying capability of 12,497.86 N. From the perspective of stability, it is possible to note that the Pratt truss failed at 217.53 N, whereas the Warren and Howe trusses demonstrated superior stability characteristics, as their respective modal/buckling loads were equal to 277.98 N. Therefore, from the standpoint of overall performance, the Warren truss is superior to other configurations due to the lowest stress values and the highest modal/buckling load, respectively. Howe truss showed comparable yield-based performance, but its stability is better compared to Pratt truss stability, despite the difference between the estimated loads. 16
Page 17
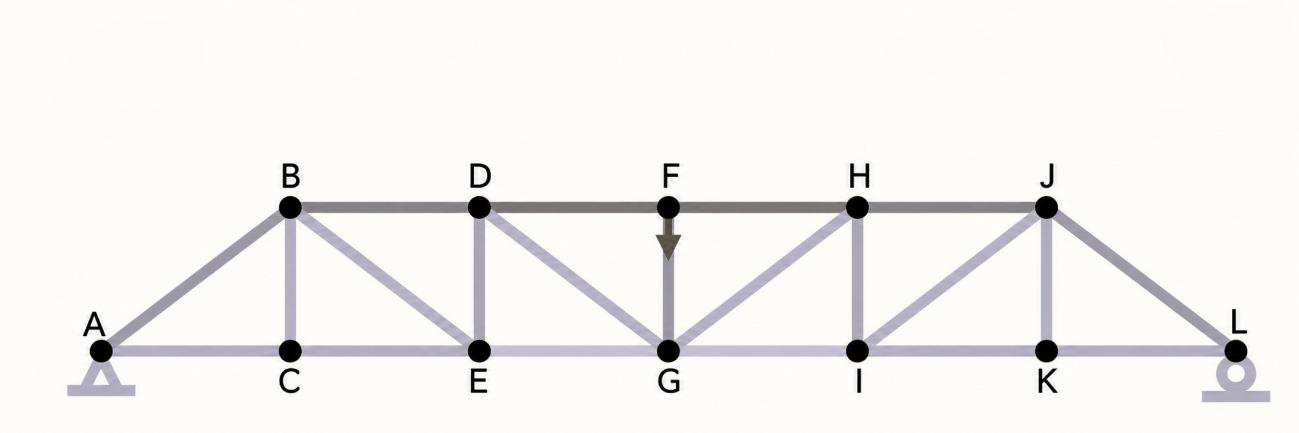
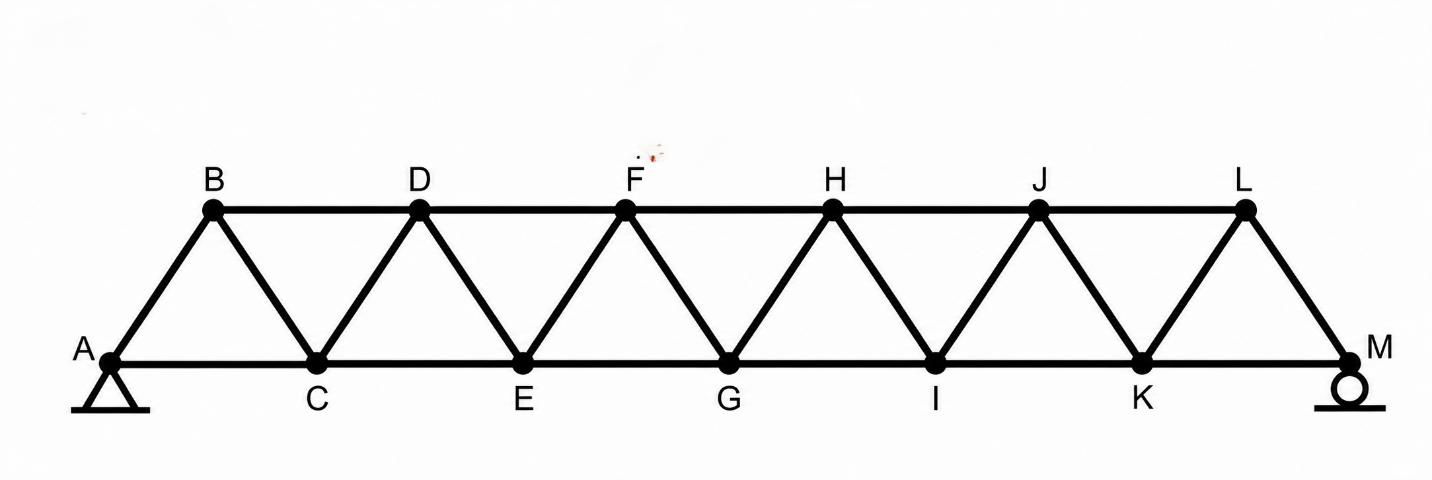
3.5 Analytical Comparison Pratt Truss: Howe Truss: Warren Truss: 17
Page 18
Using method of joints in all the trusses, Pratt truss: Maximum force = 2 N in members DF and FH, in compression Warren truss: Maximum force = 1.667 N in members EG and GI, in tension Howe truss: Maximum force = 2 N in members EG and GI, in tension Truss Crtical Max Calculated SolidWorks % Member Force Axial Stress Stress Difference Pratt Truss DF and FH 2N 7.04 psi 7.20 psi 2.27% Howe EG and GI 2N 7.04 psi 7.20 psi 2.27% Truss Warren EG and GI 1.667N 5.87 psi 5.90 psi 0.51% Truss Example calculation using Pratt Truss For Pratt Truss: 𝐹 = 2𝑁 𝐴 = 41.22 mm 2 2 𝜎 = 41.22 𝜎 = 0.04852 N/mm 2 Since: 1 N/mm 2 = 1 MPa 𝜎 = 0.04852 MPa Convert to psi: 𝜎 = 0.04852×145.038 𝜎 = 7.04 psi So, the maximum axial stress in the Pratt Truss is 7.04 psi. There is a 2.27% and 0.51% difference in the analytical and SolidWorks results, which is within the limit so the model can be validated. 18
Page 19
- References o Hibbeler, R. C. Structural Analysis. Pearson Education, 10th edition, 2018. o Beer, F. P., Johnston, E. R., DeWolf, J. T., and Mazurek, D. F. Mechanics of Materials. McGraw-Hill Education, 8th edition, 2020. o Gere, J. M., and Goodno, B. J. Mechanics of Materials. Cengage Learning, 9th edition,
o Dassault Systèmes. SOLIDWORKS Simulation Help Documentation. Dassault Systèmes SolidWorks Corporation. o Meriam, J. L., Kraige, L. G., and Bolton, J. N. Engineering Mechanics: Statics. Wiley, 9th edition, 2020. 19
MEMT 508, Louisiana Tech University